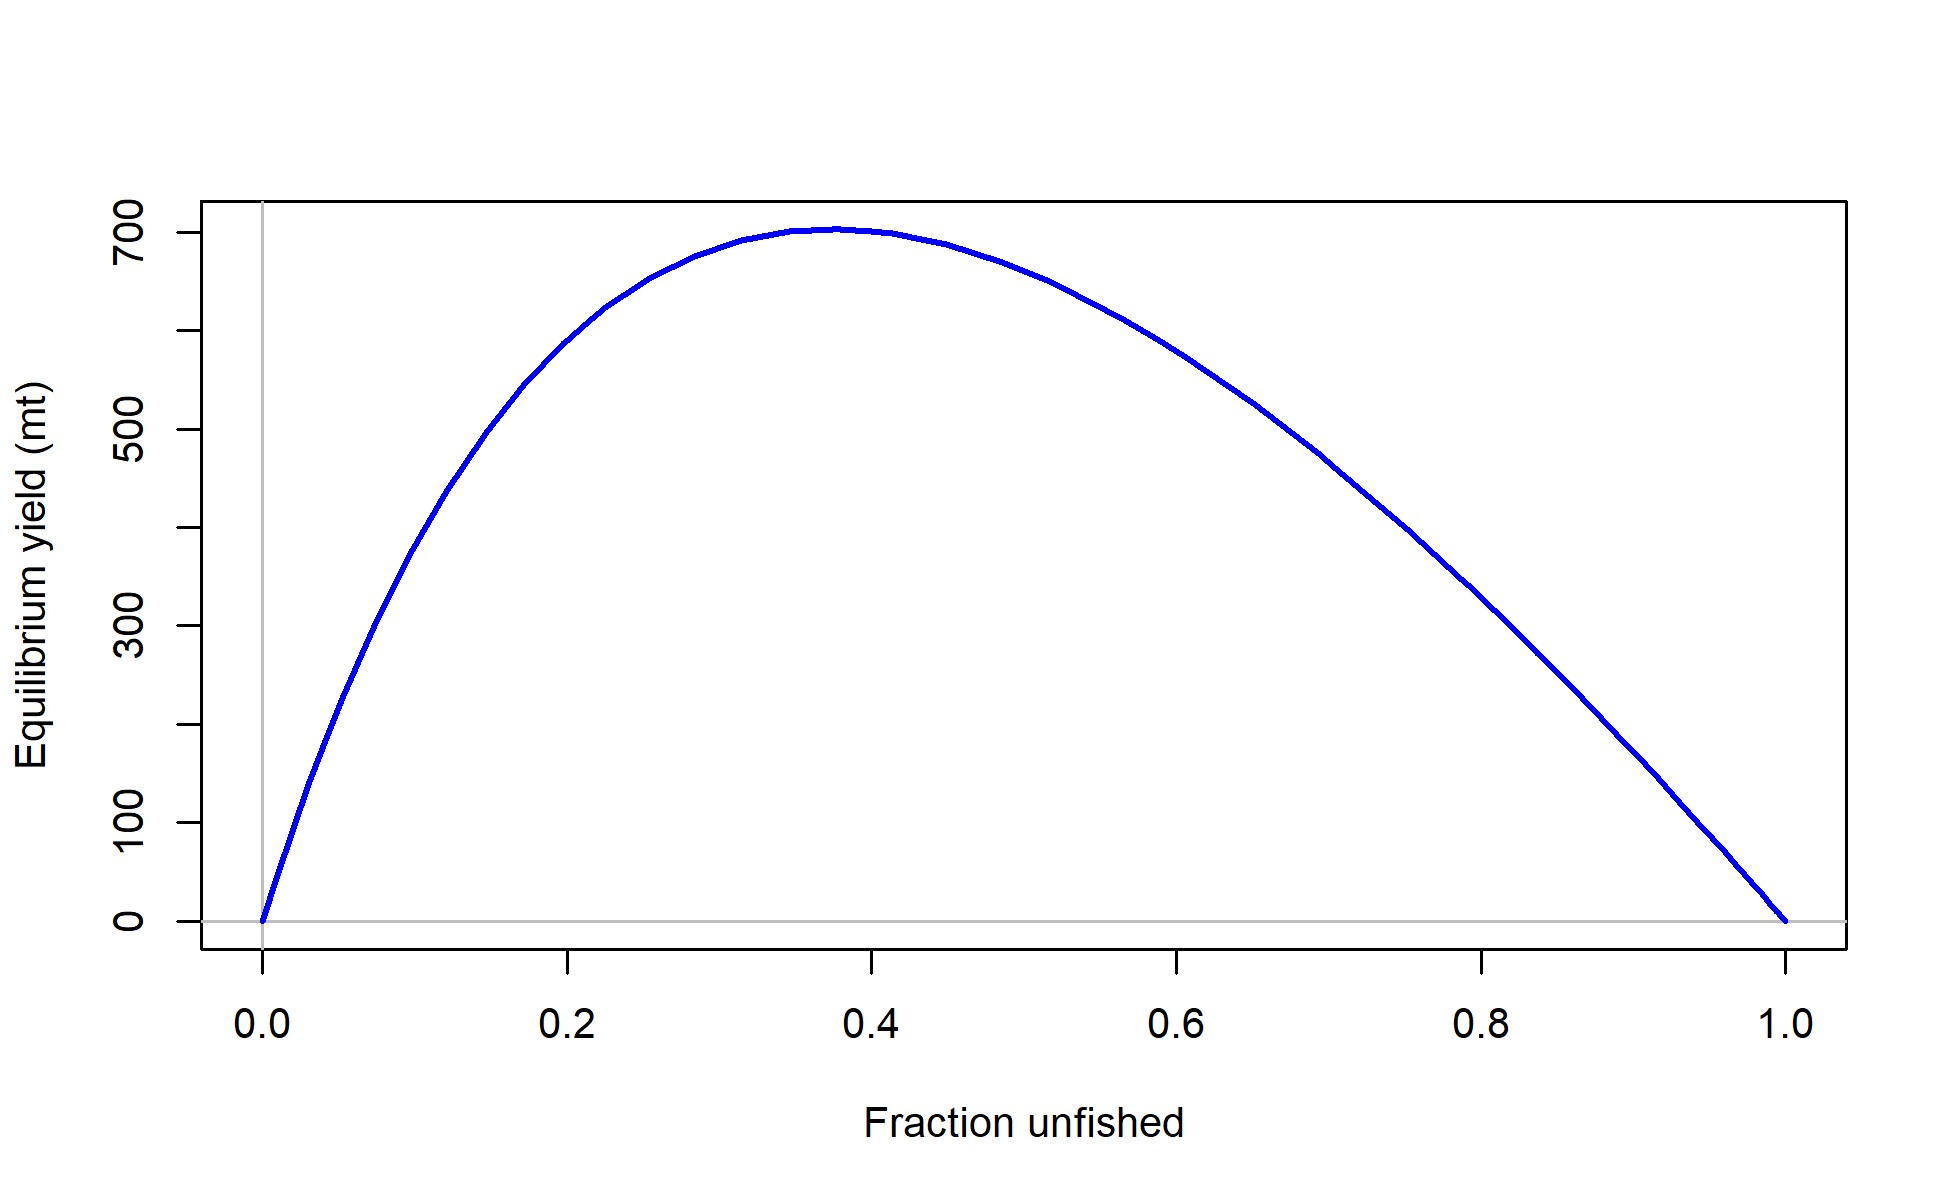
Yield curve
file: yield1_yield_curve.png

Yield curve
file: yield1_yield_curve.png

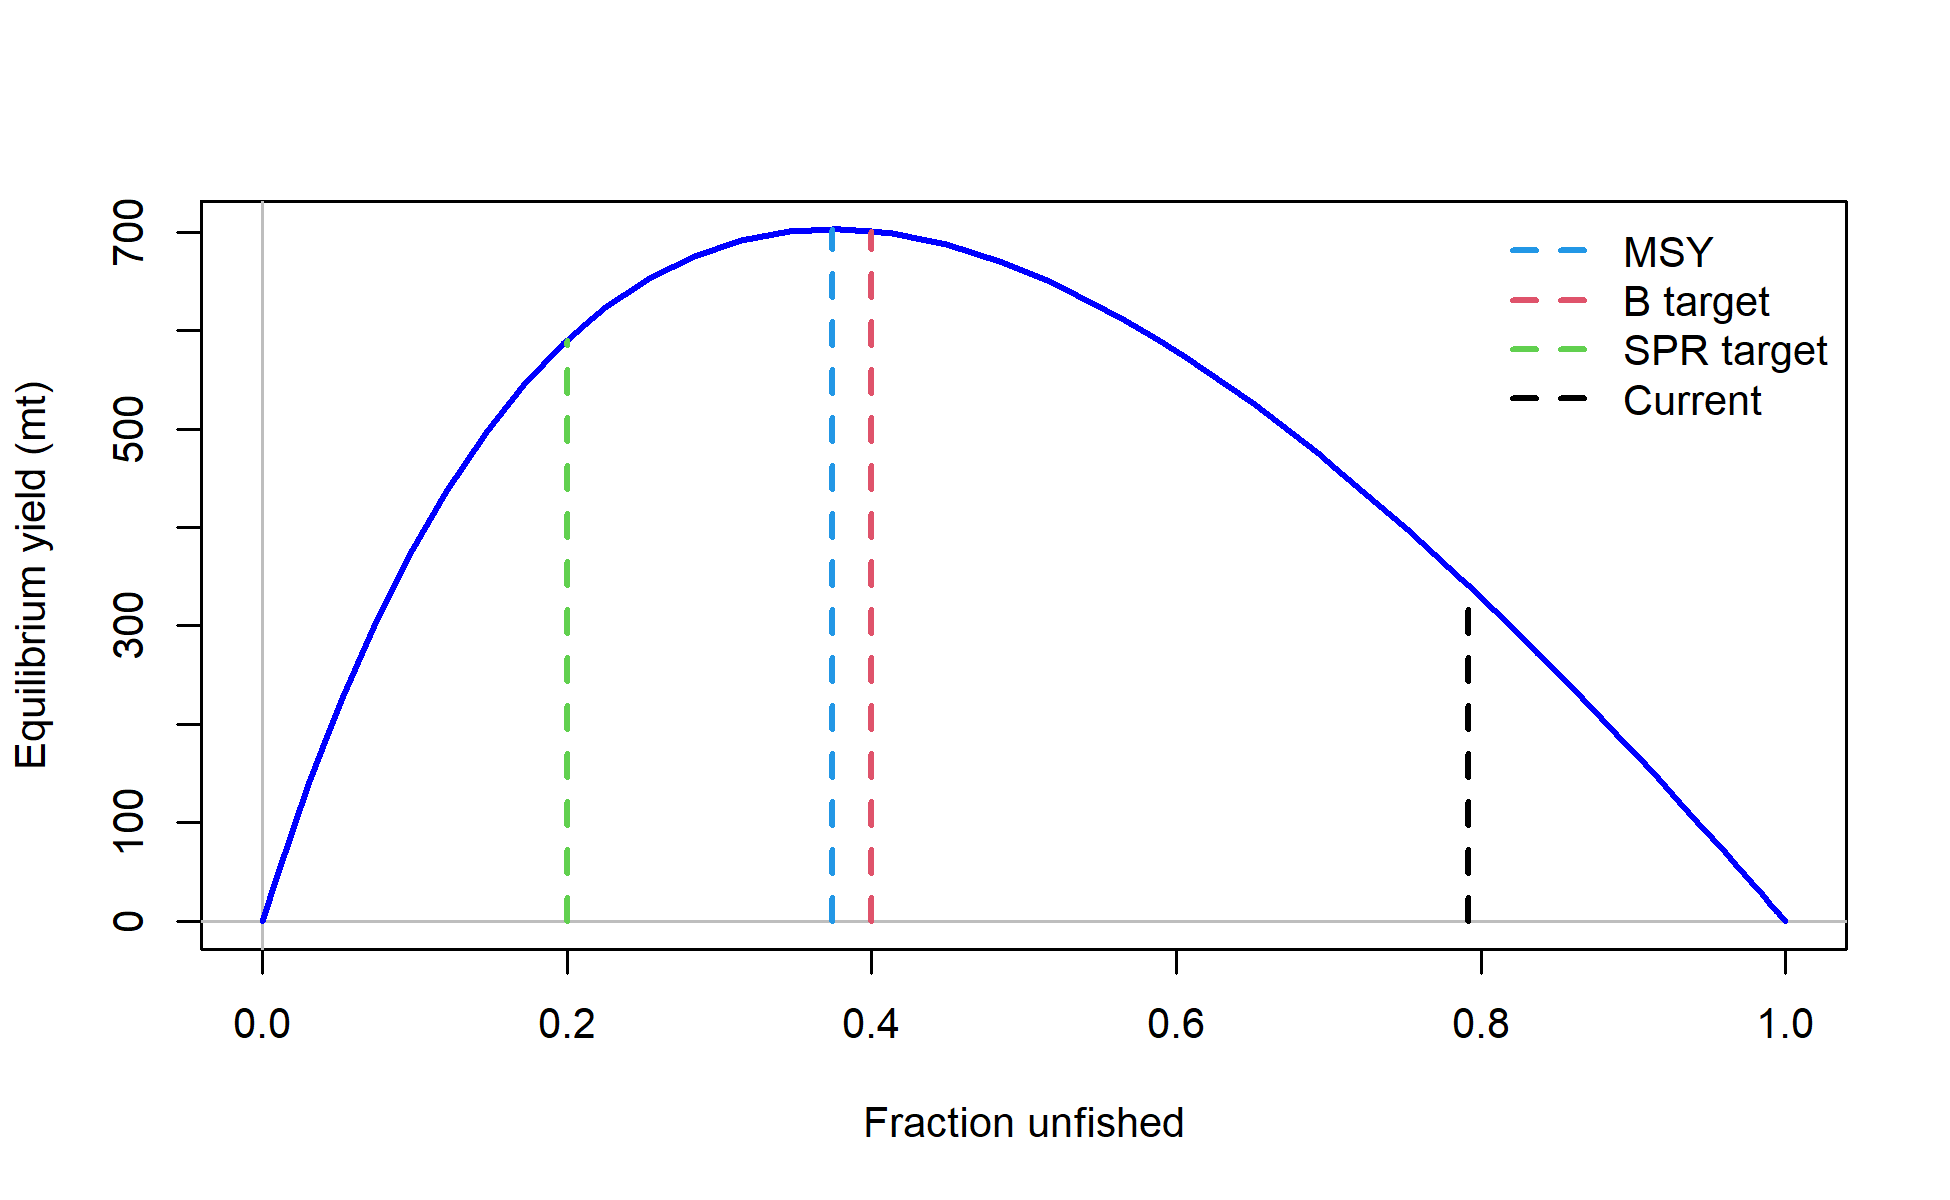
Yield curve with reference points
file: yield2_yield_curve_with_refpoints.png

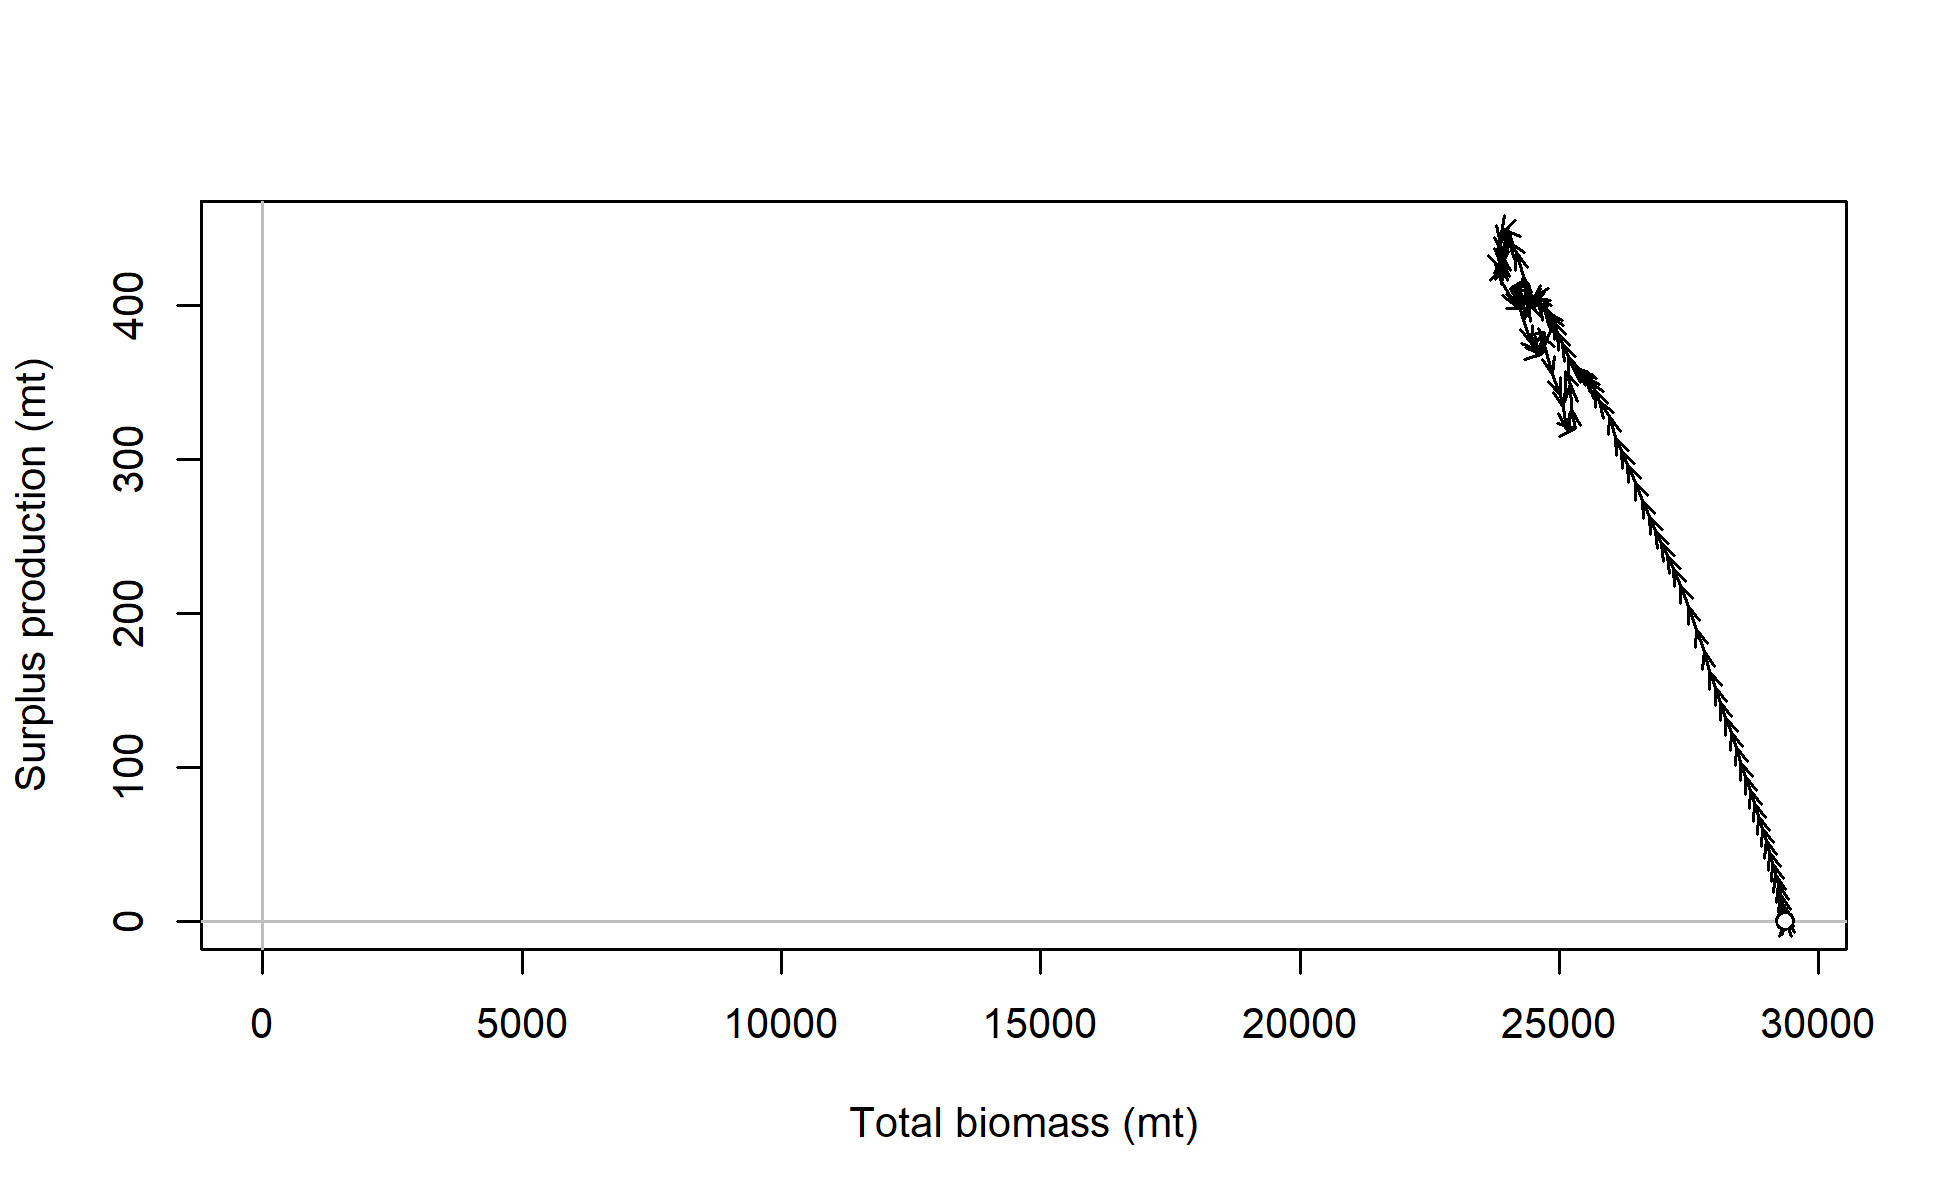
Surplus production vs. biomass plot. For interpretation, see
Walters, Hilborn, and Christensen, 2008, Surplus production dynamics in declining and recovering fish populations. Can. J. Fish. Aquat. Sci. 65: 2536-2551.

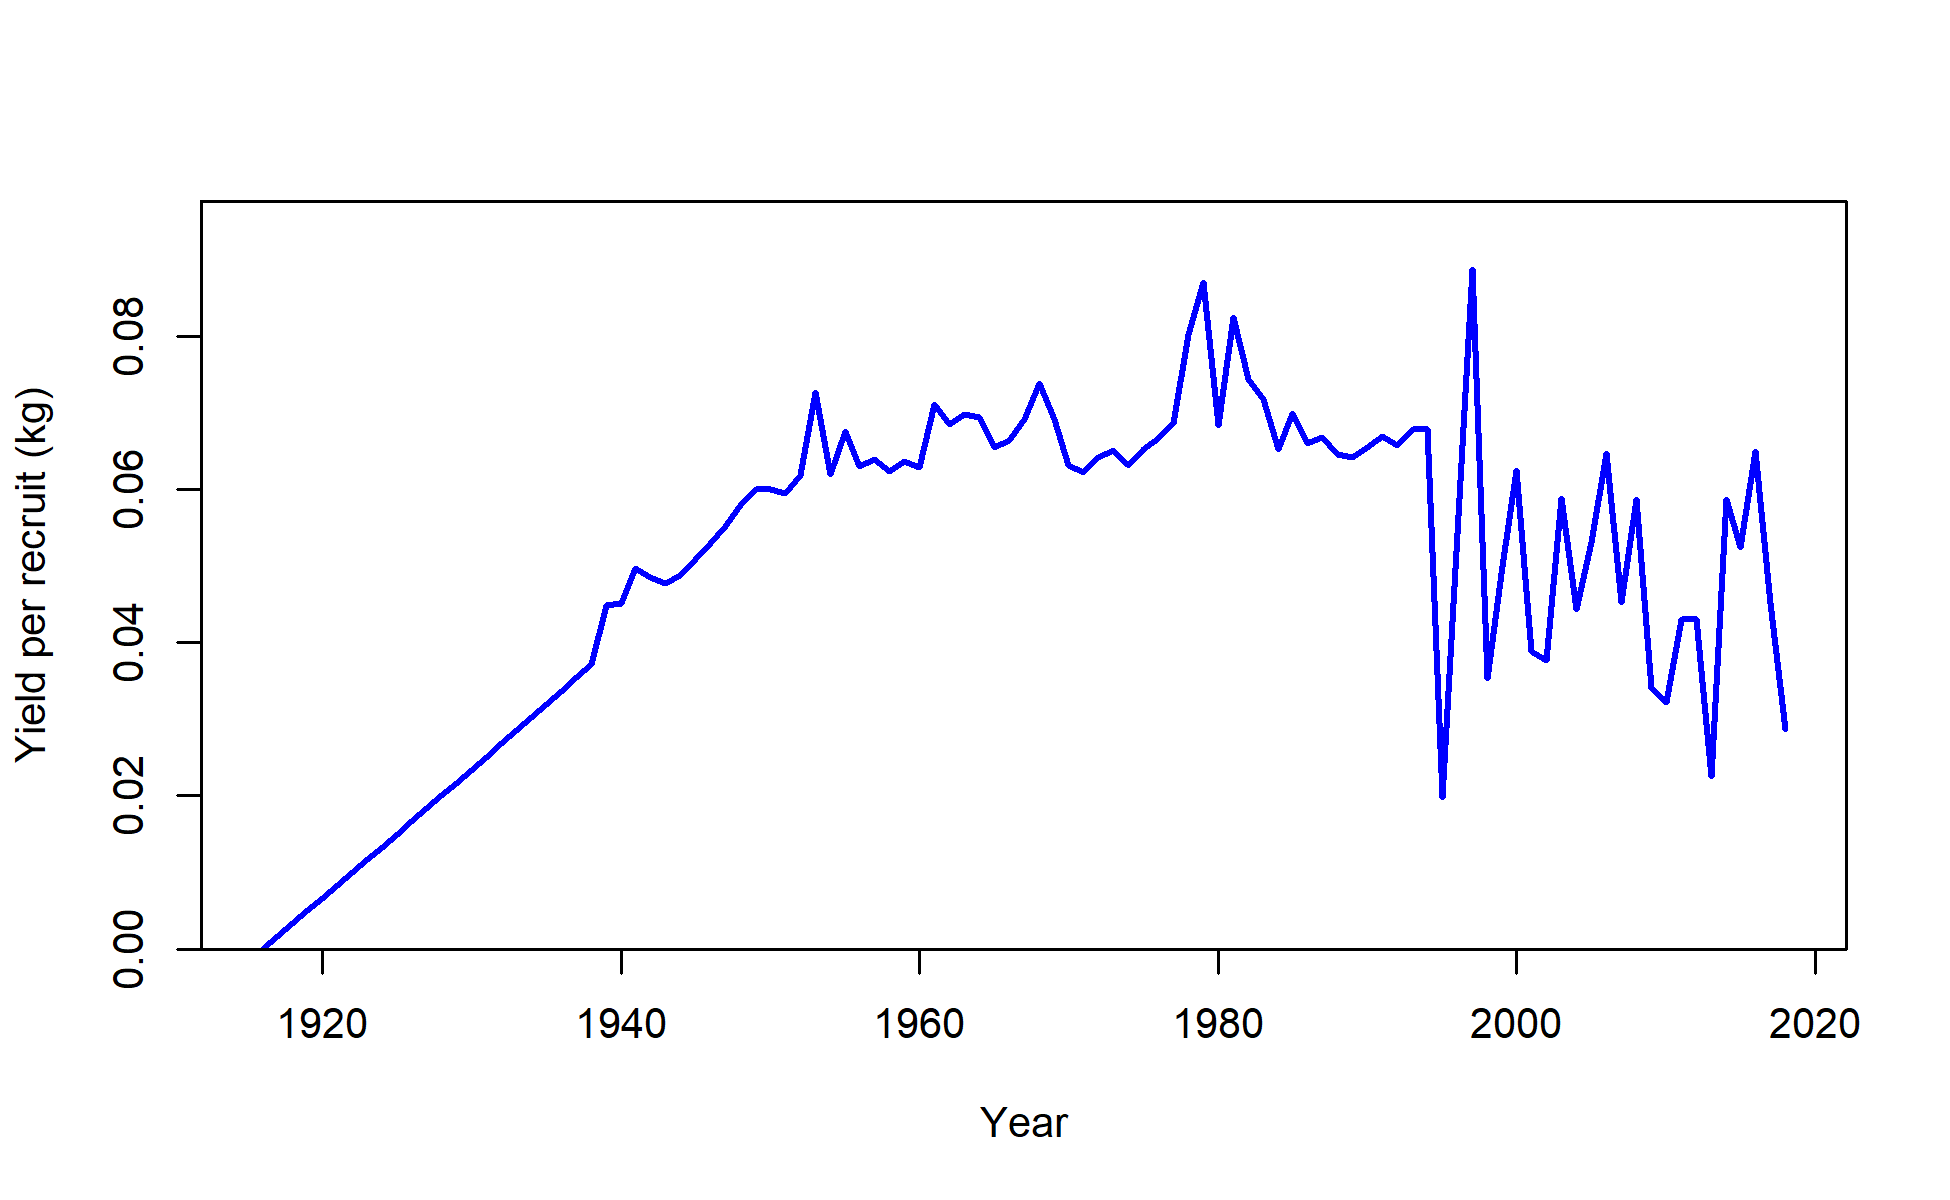
Time series of yield per recruit (kg)
file: yield4_YPR_timeseries.png